Break Even Analysis
The break-even point (BEP) is the point at which the cost of producing a product or providing a service exactly matches the revenue gained from selling that product or service. For example, if a firm’s total annual costs are £1m and in the same year it generates £1m of revenue, then the firm is said to have broken-even, as it hasn’t made any more or less than it has invested:

Image source: http://www.chegg.com/homework-help/definitions/break-even-point-37
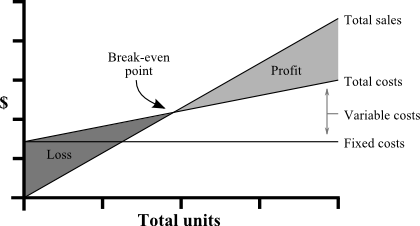
Figure 1. Break Even Point
The fixed costs (horizontal line) do not vary with output – they are the costs of running the business. The variable costs (line starting on top of fixed costs) are directly related to volume and increase or decrease as production and sales increase or decrease. Together they add up to give total costs. The revenue line (starting from zero) shows the total sales at a given price and volume. The BEP is the point at which the revenue and total cost lines cross.
A working example:
A designer mug costs £10 to buy. The variable costs are £6 per mug which makes the contribution to fixed costs £4 per unit. The total fixed costs are £12,000. The BEP point is calculated as follows:
Fixed costs / contribution per unit 12,000 / 4
Fixed costs / price – variable costs = BEP = 300 units
Or in terms of value
BEP in units x price per unit 300 x £10 = £30,000
This is a simple and straight-forward technique that is widely used. It will show the profit or loss made at different levels of output, the BEP at different prices and the effect on the BEP and profit if costs change.
The BEP analysis is often used as a tool in price setting. A company can produce several variations of this chart to compare the revenue, total cost and BEP for different price scenarios. Whilst it won’t give an absolute answer it will highlight the options that should be avoided.
The major disadvantage with break-even analysis is that demand is assumed to be inelastic. It suggests that a higher price will make the revenue curve steeper and therefore lower the BEP. However in reality there will often be a maximum price that customers will pay. This will vary by customer and be dependent on many factors including the cost of switching and the availability of alternatives. The BEP is therefore more about whether a company can sell enough to break-even rather than about what volume they can expect to sell. It must be remembered that this is a revenue curve, not a demand curve.
Another downside of break-even analysis is that it focuses on how to break-even rather than achieve a specific objective, such as percentage market share or a specific return on investment (ROI).
That said, analysing the BEP can help to determine whether a new product has enough critical mass to make a profit and is feasible to be launched. It can also be used to support business cases where funding is needed by demonstrating that a product can be made and sold profitably.
As a result, we can see that BEP analysis should be used for evaluation purposes rather than to base decisions on.
